Performance
Choose results that match your model, batch size and hardware. The published 21 September 2026 campaign measures warmed FP64 forward waveform generation for TaylorF2, IMRPhenomD and IMRPhenomXAS, with both polarizations on 1,969 frequency bins. CPU measurements use one logical Ryzen 9 7950X3D CPU; GPU measurements use an RTX 5090. A separate 22 September PhenomXPy comparison measures IMRPhenomT/THM time-domain polarizations on an Apple M4 Max CPU.
Reading the results
| Your workload | What the campaign shows | Results |
|---|---|---|
| One waveform on CPU | LALSimulation has the lowest measured latency for each of the three models. | CPU results, B = 1 |
| Large batches on CPU | At B = 1,000, compiled DiffGW PyTorch has the lowest measured batch latency for PhenomD and PhenomXAS. | CPU scaling |
| Batches on GPU | Ordering varies with model, batch and backend; compilation and workload size matter. | GPU scaling |
| Time-domain T/THM on CPU | Compare PhenomXPy Numba with DiffGW Torch eager and JAX JIT, with agreement failures marked. | PhenomXPy timings |
| Gradients, inference or memory limits | These workloads have no published measurements in this campaign. | Evidence gaps |
The overview below shows milliseconds per complete batch of 1,000 binaries; lower is faster. The full report includes all four batch sizes, TaylorF2, exact tables and accuracy failures.
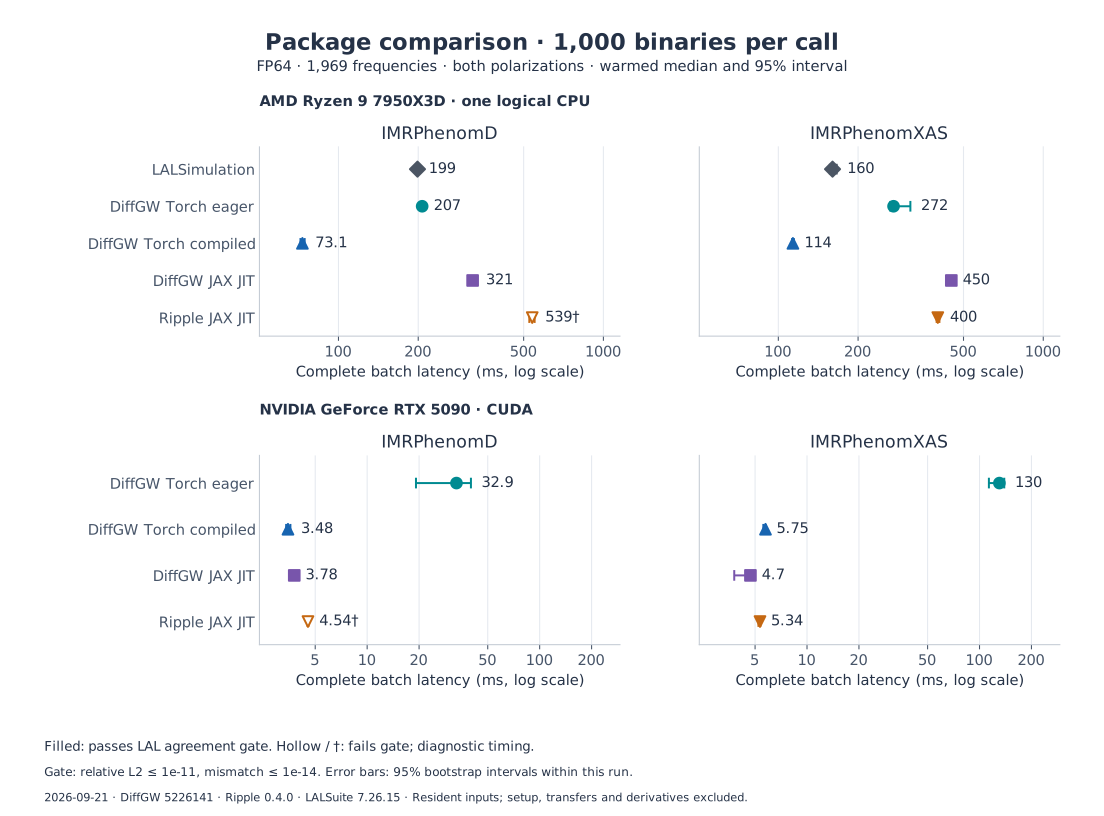
Axes are logarithmic with a shared scale within each hardware row. Error bars are 95% bootstrap intervals within the recorded run; they do not describe variation across machines or independent campaigns. Filled markers pass the campaign's strict LAL agreement check; hollow markers are diagnostic timings that fail it. Read the qualification criteria and errors before interpreting a timing. Agreement with a reference implementation and physical accuracy are separate questions.
For batch size \(B\) and complete-batch time \(t\), throughput is \(B/t\) and amortized time is \(t/B\). Only \(B=1\) measures single-waveform request latency. Inputs are already on the device and outputs are synchronized. Setup, transfers and derivatives are excluded; the adapter timing boundary records package-specific overheads. Ratios between GPU results and CPU LAL combine hardware and implementation differences.
Measured scope
| Published campaign | Scope and source | Evidence |
|---|---|---|
| 21 September 2026: FP64 forward waveforms | TaylorF2, PhenomD and PhenomXAS; batches 1–1,000; source 5226141 |
CPU/CUDA plots, raw timings, reference errors, environment and reproduction commands |
| 22 September 2026: PhenomXPy comparison | PhenomT and PhenomTHM; batches 1–1,000; Apple M4 Max CPU; source hashes recorded | CPU plot, raw timings, PhenomXPy agreement errors, environment and reproduction commands |
Each report is a dated measurement of its pinned source, not a performance claim for every subsequent version. Detailed settings, numerical tables and receipts are maintained alongside each campaign.
Compilation and derivatives
The usage guide shows JAX JIT,
vectorization and shape bucketing. The benchmark CLI examples
show compiled PyTorch execution. dynamic=True and bucketing can reduce
recompilation, but a new shape, dtype, bucket or static configuration can still
compile. Warm the signatures used by your workload before timing.
The frequency-domain campaign checks that Torch captured at least one graph; it does not establish that the complete call is compiled. First-call costs include cache loading or compilation, with caches not cleared, so they do not measure isolated compilation or cold start. Derivative availability and order are model-specific.
Workloads without published measurements
The published campaigns do not measure derivative, Fisher, likelihood, FP32 or peak-memory workloads. The time-domain measurement covers only T/THM on CPU, with no compiled PyTorch or precessing T-family results. Neither supplies a controlled cold-start result or end-to-end inference speedup. These require separate matched workloads, numerical checks and saved measurements. The NUTS tutorial is an API walkthrough, not a benchmark or converged inference result.
Reproduction
To reproduce published numbers, use the campaign commands and receipts. To design another measurement, follow reproduction and methodology. The latter also distinguishes the maintained package runner from local profiling and legacy tools.